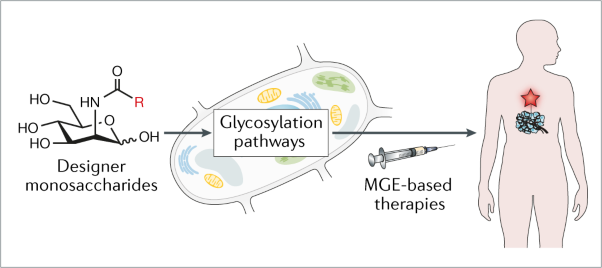
This webpage describes the use of metabolic glycoengineering (MGE, a technique introduced on our Research Area 1 page) to study, diagnose, and treat human diseases such as cancer and osteoarthritis. Specifically, Section 2.1 provides and overview of current efforts to apply MGE to treat human disease; Section 2.2 describes the use of high flux “1,3,4” analogs as labeling, diagnostic, and glycoproteomic tools; Section 2.3 describes progress towards developing these compounds as cancer drug candidates; and Section 2.4 describes the potential for exploiting the anti-inflammatory properties of “3,4,6” analogs to treat osteoarthritis.
2.1 Medical Applications of MGE
2.1.1 Introduction and Background. Prospects for developing biomedical applications of MGE are discussed in detail in our review article “Exploiting metabolic glycoengineering to advance healthcare”
2.1.2 Examples of Therapeutic Applications of MGE. To date, biomedical applications of MGE have often focused on cancer; two illustrative examples are given in Figure 2.1.2. In Panel A, tumor infiltrating mesenchymal stem cells (MSCs) are labeled ex vivo using an MGE strategy (Layek et al) and then introduced into the body where they seek out tumors allowing them to be imaged. Panel B illustrates and immunotherapy approach reported by Qiu and coworkers that begins with inoculation of tumor-bearing animals with KLH conjugated with GM3NPHAc, a form of ganglioside GM3 containing the N-phenylacetido-form of sialic acid. Subsequent injection with ManNPhAc leads to selective metabolic incorporation of this analog into cancer cell-displayed GM3, sensitizing the tumor to antibodies generated to the vaccine leading to cancer cell targeting by host immunity via antibody-directed cell cytotoxity (ADCC), complement mediated cytotoxicity (CMC), or antibody-dependent cellular phagocytosis (ADCP).
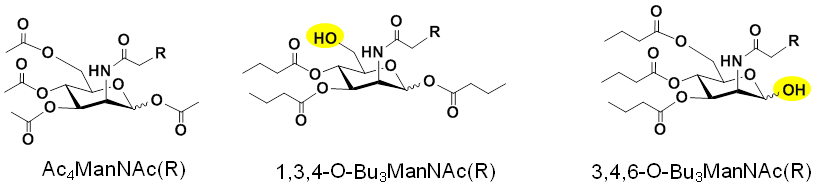
2.1.3. Improving Analog Design to Improve Efficiency and Facilitate Bioactivity. As shown above in Figure 2.1.2(A), most MGE experiments use peracetylated hexosamine analogs, exemplified by Ac4ManNAz. As described in Research Area 1, our group developed “1,3,4” and “3,4,6” tributanoylated analogs that have increased efficiency and unique biological activities compared to their peracetylated counterparts (Figure 2.1.3).
Our research group is developing applications for tributanoylated hexosamine analogs, examples of these studies are summarized below.
2.2 Exploiting “1,3,4” Analogs as Labeling, Glycoproteomic, and Diagnostic Tools
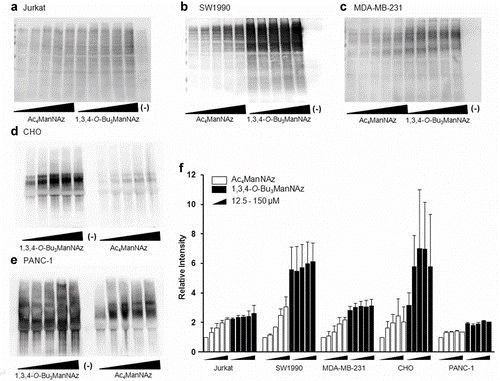
2.2.1 “1,3,4” Analogs Facilitate Efficient, High-flux Glycan Labeling. Peracetylated hexosamine analogs (e.g., Ac4ManNAz, Figure 1.1.3) have been widely used in MGE labeling experiments. Our discovery and development (Aich et al, 2008) of non-cytotoxic, high flux “1,3,4” tributanoylated analogs (Figure 2.1.3) provide a superior alternative for MGE labeling (Figure 2.2.1).
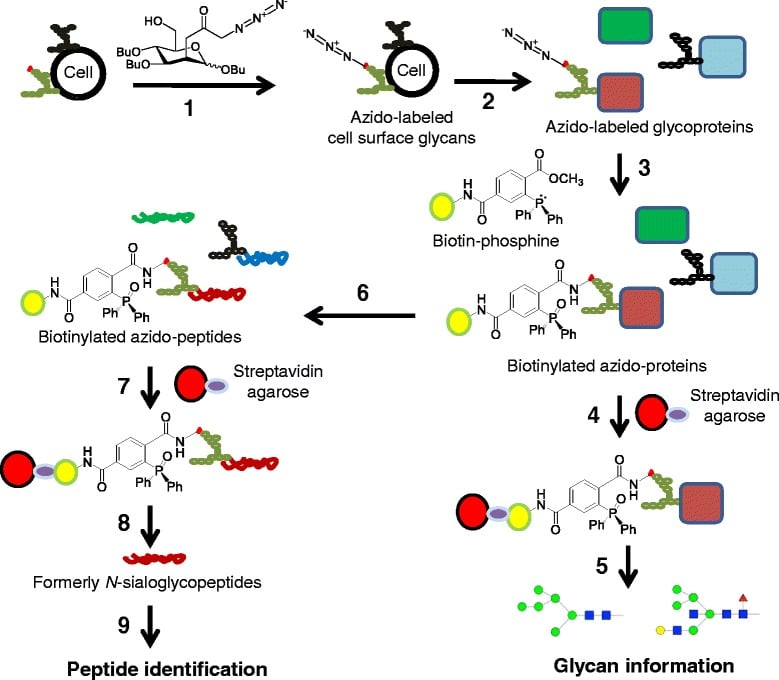
2.2.2 “1,3,4” Analogs as Glycoproteomic Tools. Metabolic glycoengineering has been used to label newly-made glycoproteins in living cells and animals; again, Ac4ManNAz is a widely used analog for glycoproteomics experiments where the “tagged” proteins are analyzed by mass spectrometry. Our team has shown that 1,3,4-O-Bu3ManNAz is a superior alternative for these experiments, which are summarized in Figure 2.2.2.
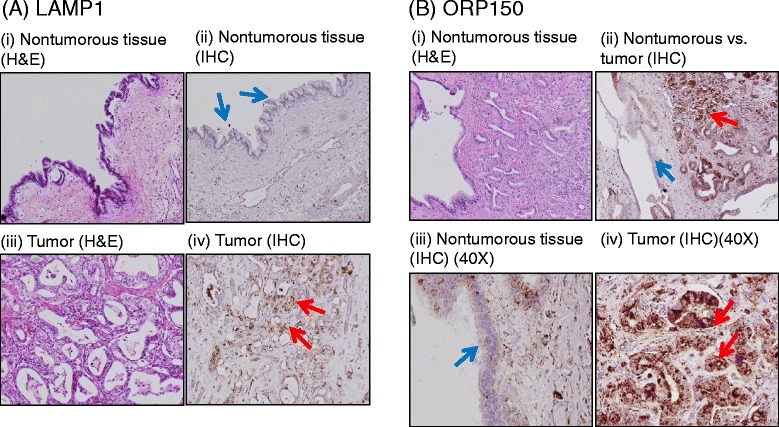
2.2.3 “1,3,4” Analogs Have Diagnostic and Biomarker Potential. The MGE labeling strategy just described was combined with mass spectrometry to analyze sialoglycoproteins in the SW1990 human pancreatic cancer line (Tian et al, 2015). This method identified 75 unique N-glycosite-containing peptides from 55 different metabolically labeled sialoglycoproteins of which 42 were previously linked to cancer in the literature. A comparison of two of these glycoproteins, LAMP1 and ORP150, in histological tumor samples showed overexpression of these proteins in the cancerous tissue (Figure 2.2.3) demonstrating that our approach constitutes a viable strategy to identify and discover sialoglycoproteins associated with cancer, which can serve as biomarkers for cancer diagnosis or targets for therapy.
2.3 Developing “1,3,4” Analogs as Cancer Drug and Theranostic Candidates
2.3.1 Synergy of 1,3,4-O-Bu3ManNAc and EGFR-targeting TKI Drugs. Higher than normal levels of sialic acid are often associated with cancer suggesting that 1,3,4-O-Bu3ManNAc, which increases flux through the sialic acid biosynthetic pathway, would be oncogenic. Accordingly, we found it surprising that this analog showed inhibitory activity against pancreatic cancer cell lines (Mathew et al, 2016). At first, we attributed this activity to the butyrate groups, which are liberated by non-specific intracellular esterases (Mathew et al, 2012) and can function as HDAC inhibitors (Sampathkumar et al, 2006). For context, when we made this discovery (ca., 2006), the first clinically successful HDAC inhibitor (a hydroxamic acid derivative SAHA, also known as vorinostat [Zolinza®] had just been approved by the FDA to treat cutaneous T-cell lymphoma. Therefore we reasoned that the HDAC inhibitory properties of butyrate generated from 1,3,4-O-Bu3ManNAc had potential anti-cancer potential despite any confounding pro-oncogenic activity resulting from increased sialylation resulting from this analog.
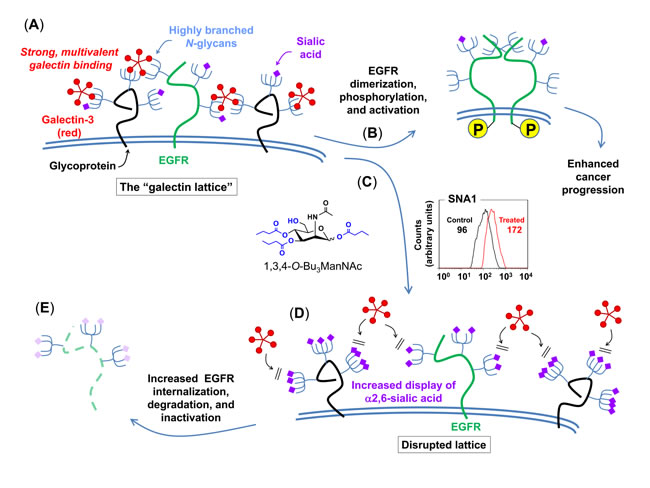
An in-depth exploration of the mechanism of action (MOA) of 1,3,4-O-Bu3ManNAc, however, revealed that this compound had anti-cancer potential because of (instead of despite) its ability to enhance sialylation. Specifically, increased sialylation in analog-treated cells disrupted the galectin lattice, a stabilizing force for oncoproteins such as the epidermal growth factor receptor (EGFR, Figure 2.3.1).
2.3.2 Theranostic Possibilities of “1,3,4” Analogs. The term theranostics is a combination of the terms therapeutics and diagnostics. First generation theranostics were exemplified by radioisotopes that allowed tumor cells to be imaged and, at the same type, delivered toxic doses of radiation to the inherent cancer cells. Related to MGE, 1,3,4-O-Bu3ManNAz allows both the imaging of tumors (the use of “azido” analogs for this purpose is reviewed by Agatemor et al, 2019) and reproduces the synergistic ability of 1,3,4-O-Bu3ManNAc to sensitize pancreatic cancer cells to TKI cancer drugs (Mathew et al, 2015). In another example of theranostic use of MGE, we describe the harnessing of cancer cell metabolism for diagnosing and treating breast cancer (Badr et al, 2017).
2.4 Exploring Glucosamine and “3,4,6” Analogs to Treat Arthritis
2.4.1 Background: Glucosamine is a (Controversial) Treatment for Osteoarthritis (OA).
2.4.1.1 Background and Introduction (adapted from Varghese et al, 2007). Osteoarthritis is a degenerative disease characterized by unbalanced synthesis of articular cartilage matrix and associated growth factors. The use of putatively chondro-protective agents such as glucosamine (GlcN) has been explored to treat OA. Glucosamine feeds production of amino-sugars used as building blocks of glycosaminoglycans (GAGs) leading to the hypothesis that dietary supplementation of GlcN stimulates cartilage regeneration, thereby alleviating symptoms of OA. The clinical impact of GlcN remains controversial, however, insofar as poor bioavailability of this compound limits in situ level in synovial fluid to submicromolar levels, which are too low to unambiguously increase synthesis of GAG building blocks (e.g., nucleotide sugars such as UDP-GlcNAc and UDP-GlcA). This led us to investigate alternative biochemical mechanisms to explain the potential therapeutic benefits of GlcN to treat OA, as described next.
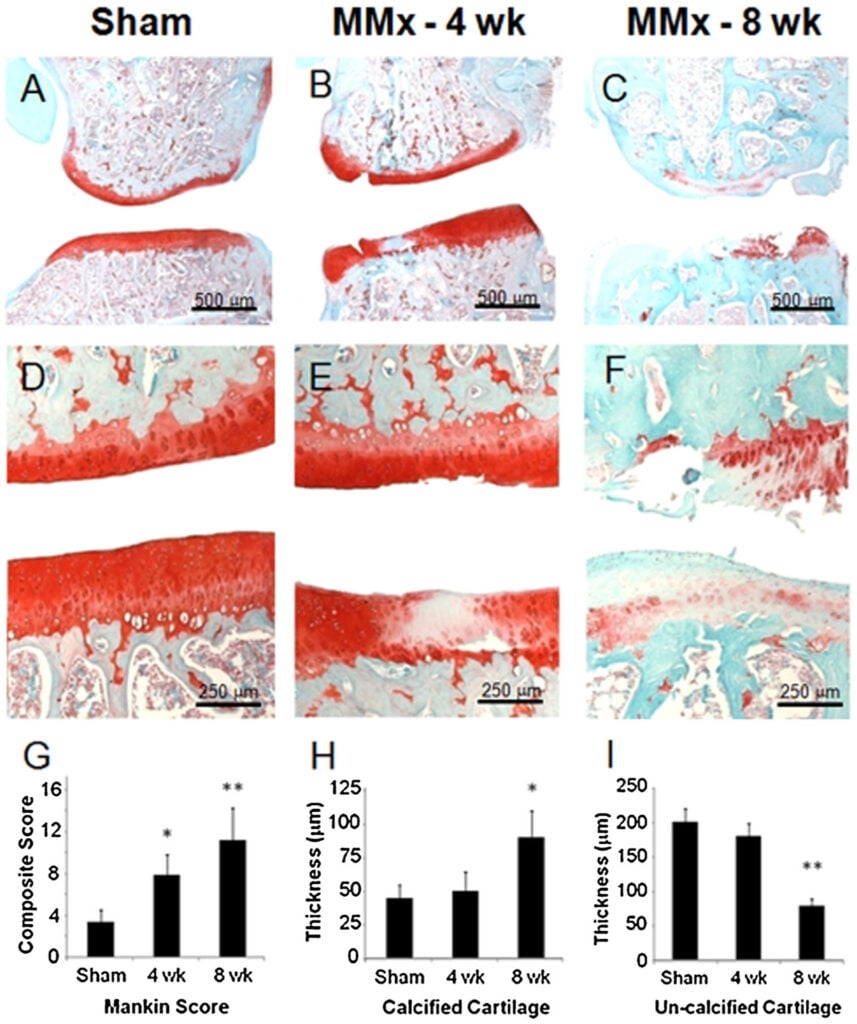
2.4.1.3 Our in vivo Results (adapted from Gibson et al, 2014). Optimum responses to GlcN require concentrations impractical with oral dosing. Accordingly we used intra-articular delivery of a bolus dose of GlcN to overcome this obstacle by locally administering GlcN to treat a meniscal transection model of rat osteoarthritis (OA). The knees of male rats underwent medial meniscal transection leading to arthritic changes over 4 weeks. Treatment groups were then given 100 μL injections of 35 μg, 350 μg, 1.8 mg, or 3.5 mg of GlcN dissolved in normal saline thrice weekly. Gross images, modified Mankin scores, and histomorphometric measurements were used as outcome measures (Figure 2.4.1.3). The 350 μg dosage of GlcN had the most significant positive impact on all components of the modified Mankin score. Together, these findings suggest the local delivery of concentrations of GlcN much higher than can be achieved through oral dosing are well tolerated and can suppress experimentally-induced OA through influences on both bone and cartilage.
2.4.1.2. Our in vitro Results (adapted from Varghese et al, 2007). We investigated dose-dependent effects of GlcN on cell morphology, proliferation, cartilage matrix production, and gene expression in primary bovine chondrocytes in monolayer (2D) and hydrogel (3D) in vitro cell culture experiments. Results from the 3D hydrogel experiments indicated a narrow window of GlcN concentrations promotes matrix production (dose-dependent improvement occurred up to 2 mM but was lost by 15 mM where the cells experienced substantial cytotoxicity). The narrow therapeutic window is consistent with previous studies that variously have reported beneficial or detrimental effects of GlcN. Mechanistically, GlcN modulated TGF-β1 signaling in chondrocytes, helping to provide a biochemical explanation for the impact of this sugar at low concentrations where flux into biosynthetic pathways is low.
2.4.2 Exploiting GlcN-derived “3,4,6” Analogs to treat OA
2.4.2.1 Hexosamines Provide a Template for Drug Development. As discussed elsewhere (e.g., in Section 1.xx), the regioisomeric placement of three butyrate groups on the four hydroxyls of mammalian hexosamines (i.e., GalNAc, GlcNAc, and ManNAc) tunes bioactivity. Indeed, the core monosaccharide provides a versatile template for drug development (Figure 2.4.2.1).
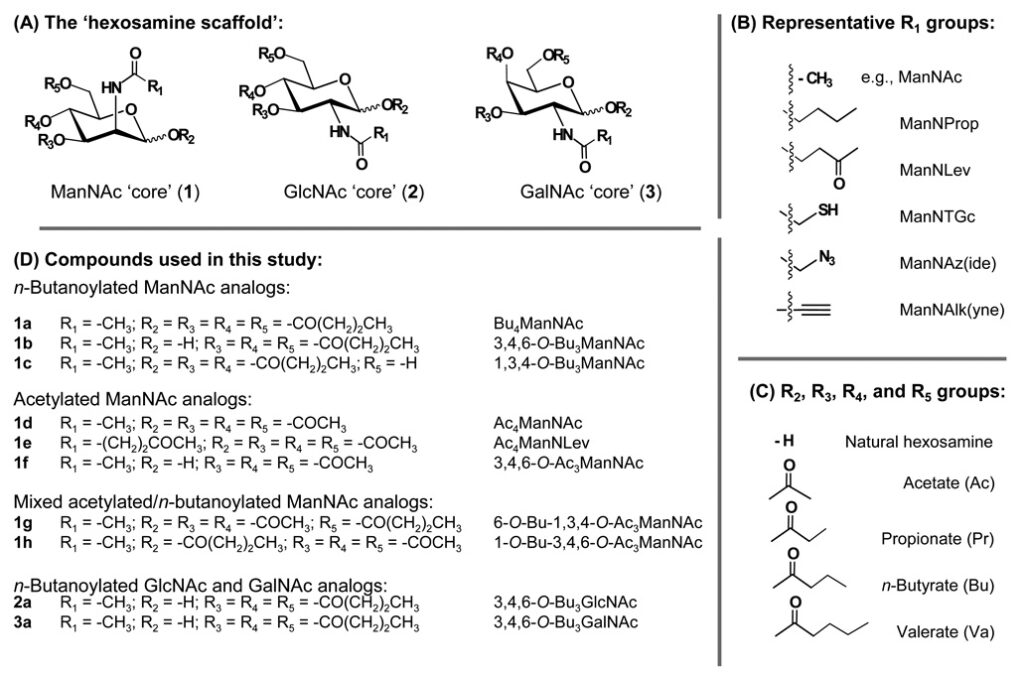
2.4.2.2 “3,4,6” Hexosamine Analogs have Anti-inflammatory Properties. We found that, of the large number of possible analogs that can be built using the hexosamine template (Figure 2.4.2.1), “3,4,6” tributanoylated hexosamines (Figure 2.4.2.2) have anti-inflammatory properties exemplified by their ability to reduce NF-κB signaling.
The “3,4,6” analogs shown in Figure 2.4.2.2 were initially considered as anti-cancer drugs due to the pro-oncogenic nature of NF-κB signaling. Overall, however, the prospects of anti-inflammatory agents as cancer drugs are uncertain based on the current paradigm that dampening the immune system contributes to cancer development. Accordingly, we directed this class of analogs to treat osteoarthritis (OA), as described next.
2.4.2.3 Cell-based Experiments Show Efficacy of 3,4,6-O-Bu3GlcNAc and 3,4,6-O-Bu3GalNAc (adapted from Coburn et al, 2013a). We investigated the anti-inflammatory and tissue production capacity of 3,4,6-O-Bu3GlcNAc, an shown to inhibit the nuclear factor κB (NF-κB) activity, a key transcription factor regulating inflammation. To mimic an inflammatory environment, chondrocytes were stimulated with interleukin-1β (IL-1β), a potent inflammatory cytokine. 3,4,6-O-Bu3GlcNAc exposure decreased the expression of NF-κB target genes relevant to OA by IL-1β-stimulated chondrocytes after 24 h of exposure. The capacity of 3,4,6-O-Bu3GlcNAc to stimulate extracellular matrix (ECM) accumulation by IL-1β-treated chondrocytes was evaluated in vitro utilizing a three-dimensional hydrogel culturing system. After 21 days, 3,4,6-O-Bu3GlcNAc exposure induced quantifiable increases in both sulfated glycosaminoglycan and total collagen. Histological staining for proteoglycans and type II collagen confirmed these findings. The increased ECM accumulation was not due to the hydrolysis products of the small molecule, n-butyrate and N-acetylglucosamine (GlcNAc), as the isomeric 1,3,4-O-tributanoylated N-acetylglucosamine (1,3,4-O-Bu3GlcNAc) did not elicit a similar response.
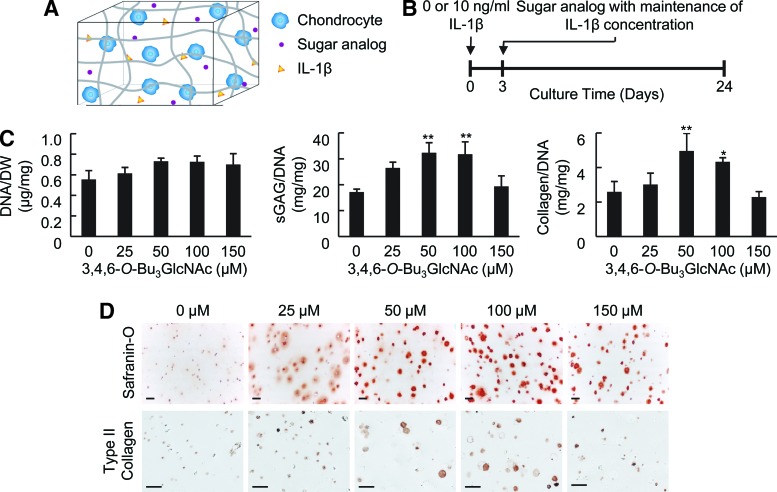
These findings demonstrate that a novel butanoylated GlcNAc derivative, 3,4,6-O-Bu3GlcNAc, has the potential to stimulate new tissue production and reduce inflammation in IL-1β-induced chondrocytes with utility for OA and other forms of inflammatory arthritis. In a follow-up study we found similar results with 3,4,6-O-Bu3GalNAc with stronger responses compared to 3,4,6-O-Bu3GlcNAc depending on the cell type, e.g., chondrocytes vs. MSCs (Coburn et al, 2013b).
2.4.2.4 In vivo Efficacy of 3,4,6-O-Bu3GalNAc for Treating OA (adapted from Kim et al, 2016a). Based on the superior effectiveness of 3,4,6-O-Bu3GalNAc in our cell-based assays (Section 2.4.2.3), which induces cartilage tissue production by human mesenchymal stem cells (hMSCs) and human OA chondrocytes in part by modulating Wnt/β-catenin signaling activity, we selected this analog for pilot animal testing. Specifically, we evaluated therapeutic effect of 3,4,6-O-Bu3GalNAc on the rat model of posttraumatic OA when delivered via local intra-articular sustained-release delivery using microparticles and found this method to be efficacious in preventing OA progression (Figure 2.4.2.4).
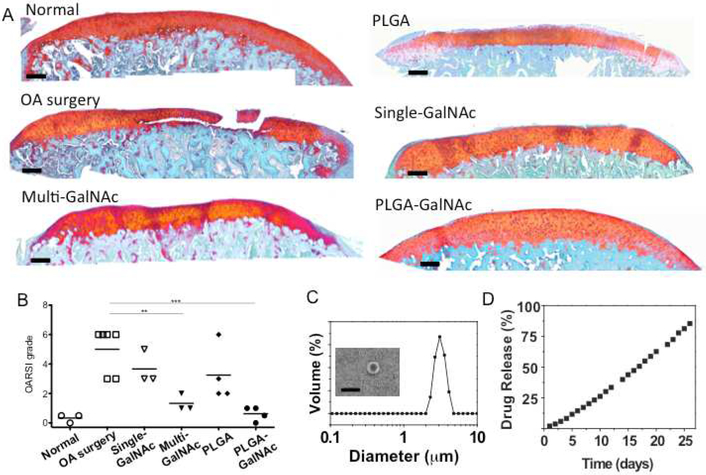
These results show that 3,4,6-O-Bu3GalNAc, a disease modifying OA drug candidate, has promising therapeutic potential for articular cartilage repair. We are developing additional delivery options, including controlled release of 3,4,6-O-Bu3GalNAc and 3,4,6-O-Bu3GlcNAc from electrospun microfiber scaffolds (Kim et al, 2016b).